Cost Management Report
「Supply-Demand Gap in MEP Work Becomes Major Cause of Construction Price Hikes
Request for Cost Pass-throughs Continue」
Scroll Down
This report has been prepared by the Cost Management Group of the Architectural Design Dept. of Nikken Sekkei Ltd for information purposes. While the information in this report is current as of the date of publication, its completeness is not guaranteed. The contents are subject to change without notice. Unauthorized reproduction of this report is prohibited.
Supply-Demand Gap in MEP Work Becomes Major Cause of Construction Price Hikes
Request for Cost Pass-throughs Continue
MEP work orders steady
Profit margins expected to fall slightly
Deviation rates for MEP work sharply increase
-
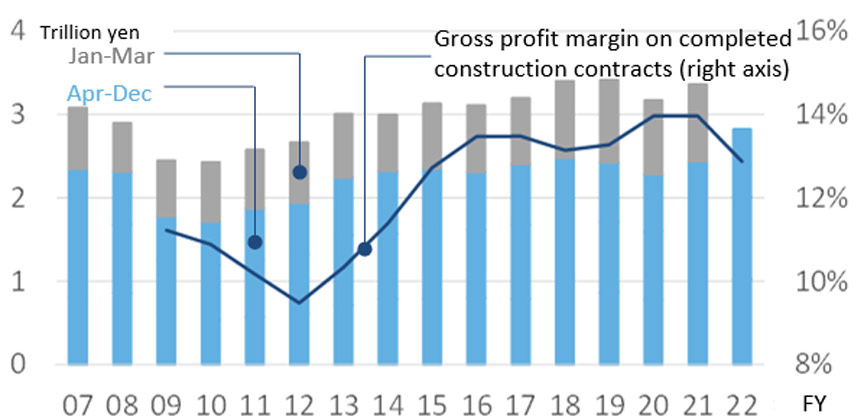 Fig.1: Change in MEP work orders
Prepared based on the Ministry of Land, Infrastructure, Transport and Tourism (MLIT)'s "Results of Survey on Orders Received in the MEP Work Industry (20 major contractors)" and each firm's financial data. Gross profit margin figures for FY2022 are as of December. -
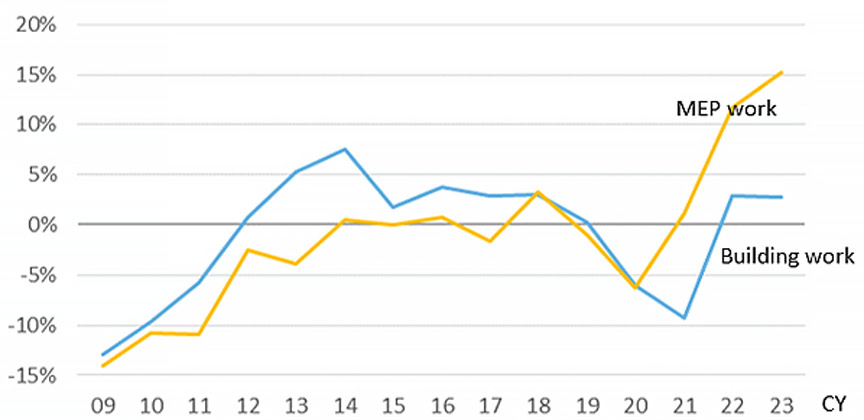 Fig.2: Average deviation rate of cost estimates by Building and MEP work*1
Source: Nikken Sekkei Ltd
The main driver behind rising construction costs is shifting from steel to MEP work costs
Requests for cost pass-throughs persist
Remain aware of downside risks
-
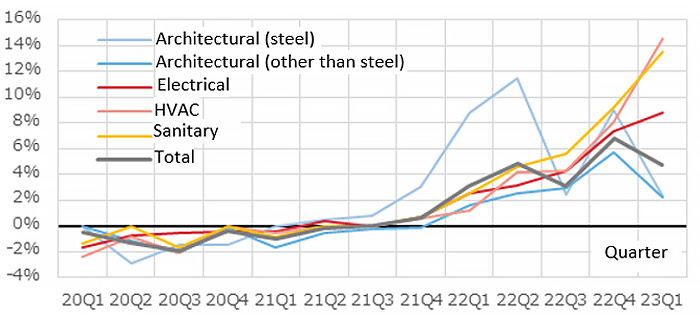 Fig.3: % change in NSBPI from the previous quarter by work type
Source: Nikken Sekkei Ltd -
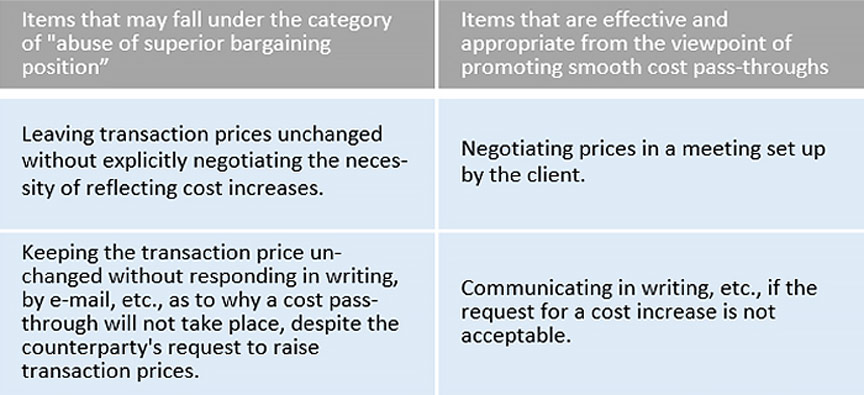 Fig.4: Appropriate contract price setting, etc.
Prepared from "Establishment of Appropriate Contract Price Reflecting Transaction Prices for Labor, Raw Materials, Energy, etc." dated March 8, 2023, by the Ministry of Land, Infrastructure, Transport and Tourism (MLIT).
Building Work Slows Slightly, But MEP Work Continues to Accelerate; Composite Index Continues to Rise
Nikken Sekkei Standard Building Price Index (NSBPI) *2
-
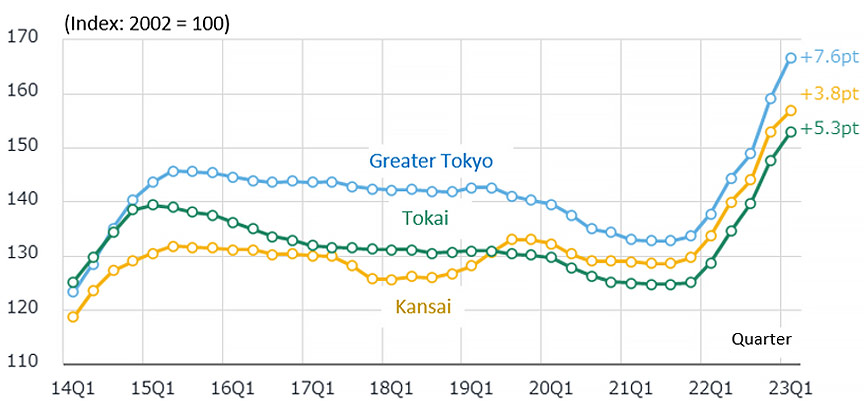 Fig.5: Changes in NSBPI
-
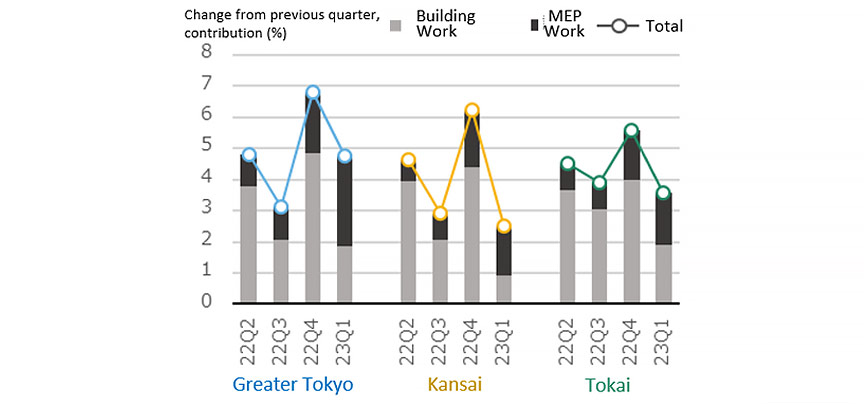 Fig.6: Percent Change in NSBPI and Contribution of Building Work and MEP Work
Manpower shortage is a factor in soaring MEP prices
Steel prices rise slow to a crawl
-
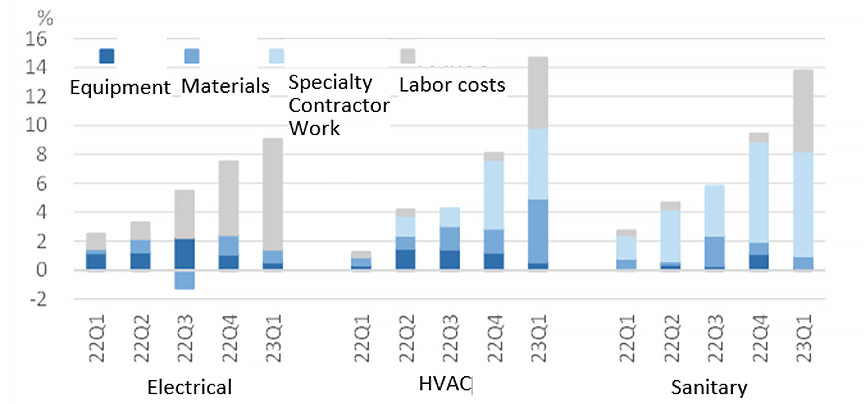 Fig.7: Contribution of construction type to NSBPI % Change in MEP Work
Source: Nikken Sekkei Ltd -
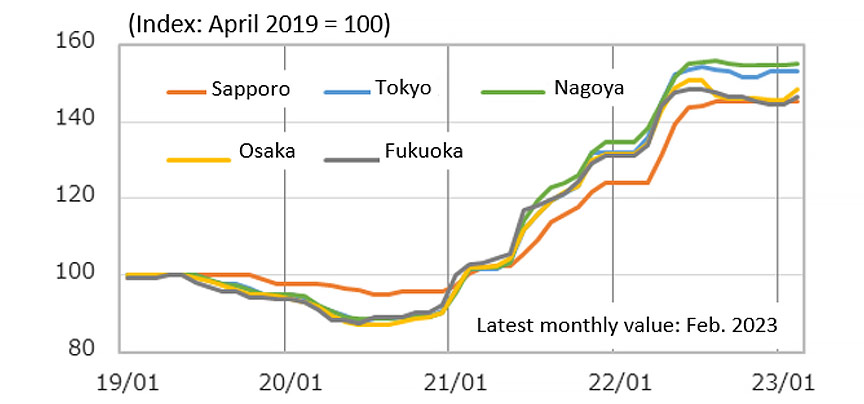 Fig.8: Steel prices (ordinary steel)
Compiled from "Cost Estimation Data" by the Economic Research Association
*1: Average deviation rate: the deviation rate that indicates how much the estimated cost deviates from the estimated price, averaged for each project by year.
*2: The Nikken Sekkei Standard Building Price Index NSBPI is calculated independently by Nikken Sekkei Ltd.
Using a standard rental office as a model, construction prices were calculated and indexed. Prevailing prices were ascertained through in-house research and reflected as needed.
The first quarter (Q1) is from January to March, Q2 is from April to June, Q3 is from July to September, and Q4 is from October to December.