Cost Management Report
「The Unfilled Supply-Demand Gap: High Work on Hand Volume for Buildings and MEP」
Scroll Down
This report has been prepared by the Cost Management Group of the Architectural Design Dept. of Nikken Sekkei Ltd for information purposes. While the information in this report is current as of the date of publication, its completeness is not guaranteed. The contents are subject to change without notice. Unauthorized reproduction of this report is prohibited.
The Unfilled Supply-Demand Gap:
High Work on Hand Volume for Buildings and MEP
Construction work on hand remains high this fiscal year
Profit margins are expected to remain low due to competition for very large projects
-
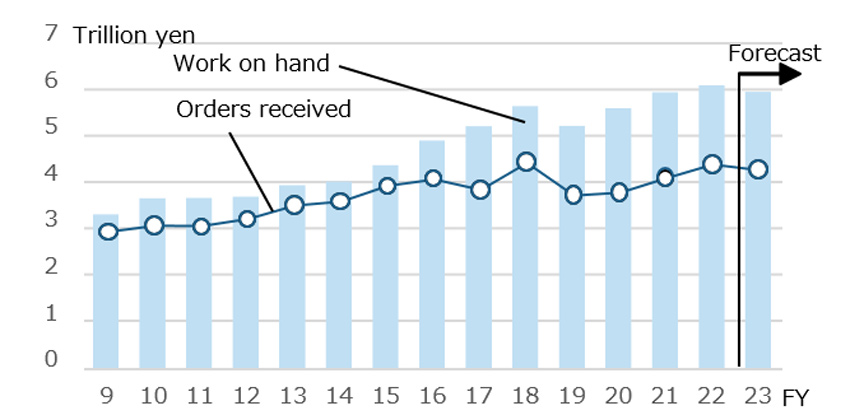 Fig.1: Trends in Work on hand and Orders Received by Major Construction Firms
Prepared from each company's financial data -
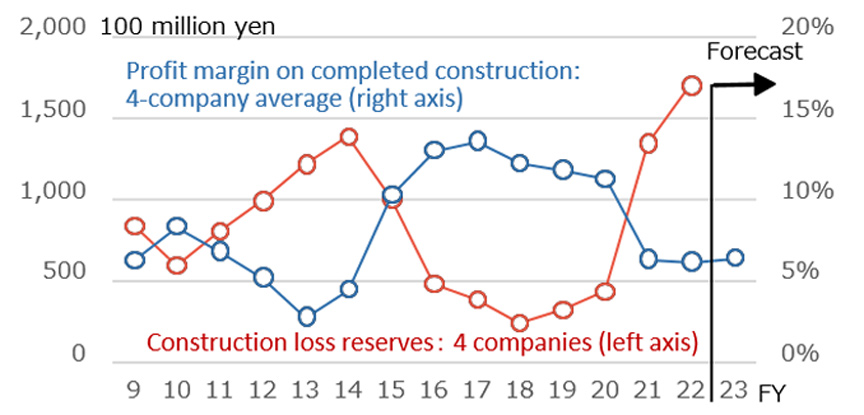 Fig.2: Profit Margins on Completed Work and Allowance for Losses at Major Construction Firms
Prepared from each company's financial data
MEP orders received are restrained due to adjustments in work on hand
Overtime work limit compliance is expanding
-
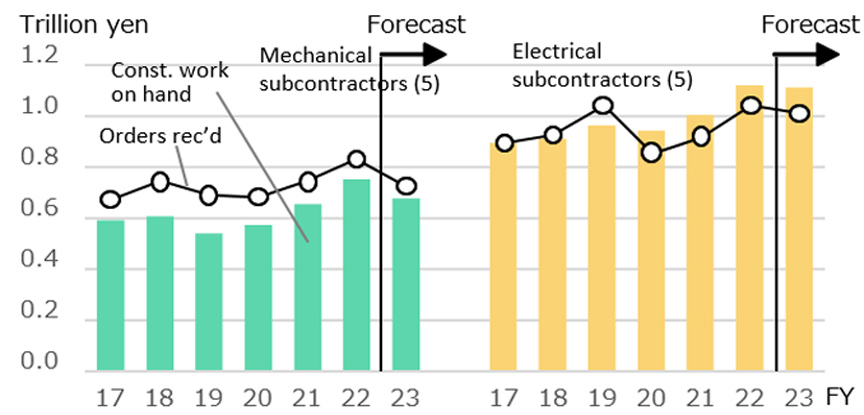 Fig.3: Change in Work on Hand and Orders Received by MEP Contractors
Prepared from each company's financial statements
Mechanical subcontractors = 5 companies total; electrical subcontractors = 5 companies total -
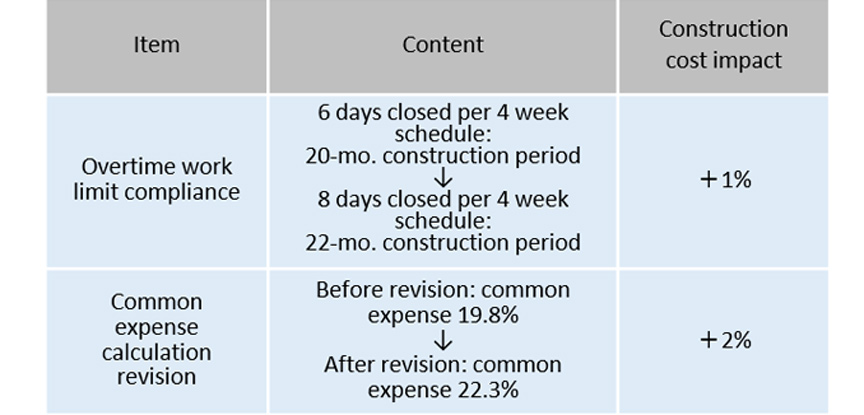 Fig.4: Impact of Overtime Work Limits and Revisions to Common Expense Formulas
Prepared based on Nikken Sekkei data, assuming an office building of 15,000 sqm.
Common expense = common temporary work costs + site management costs + general management costs
Greater Tokyo's Upward Momentum Continues, Showing Disparity with Other Regions
Nikken Sekkei Standard Building Price Index(NSBPI)*5
Construction work costs continue to rise along with increases in the prices of various materials such as ready-mixed concrete and glass, as well as price hikes for temporary work, steel frames, and finishing works. In addition to list price revisions for various types of equipment, labor and specialty work prices continue to rise due to the supply-demand gap, driving up overall construction costs (Fig. 6).
-
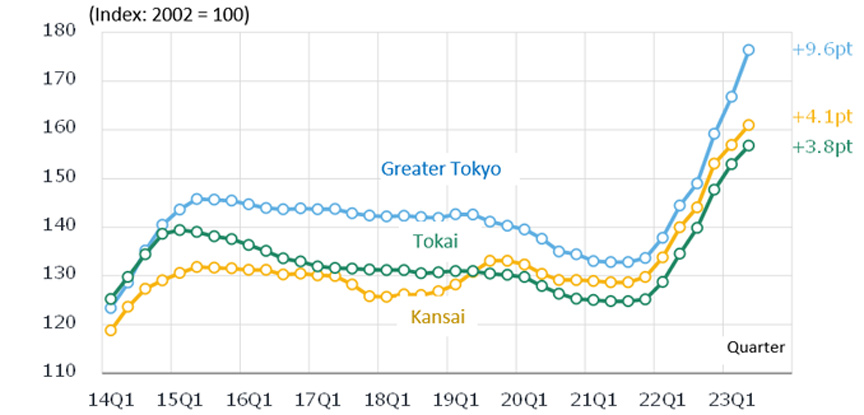 Fig.5: Changes in NSBPI
-
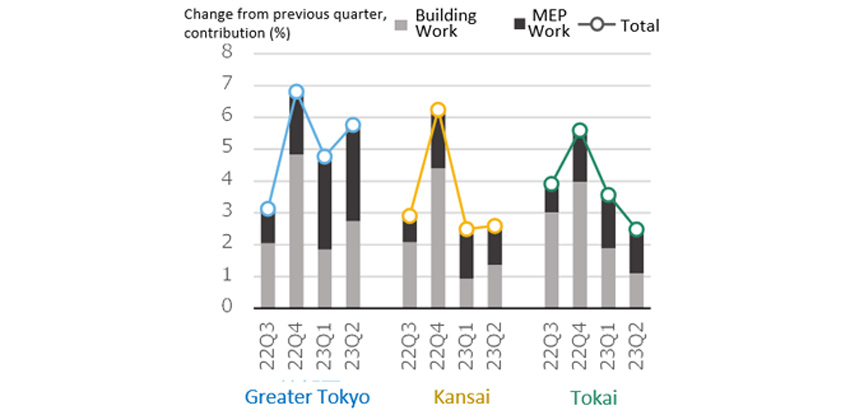 Fig.6: Percent Change in NSBPI and Contribution of Building Work and MEP Work
Individual material price indexes continue to rise
Ready-mixed concrete prices in Osaka see large price increases
-
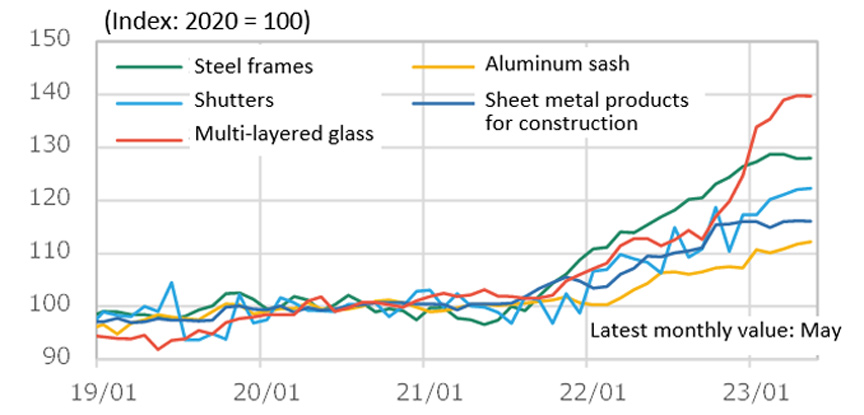 Fig.7: Trends in the Corporate Goods Price Index for Building Materials
Compiled from the Bank of Japan's "Corporate Goods Price Index” -
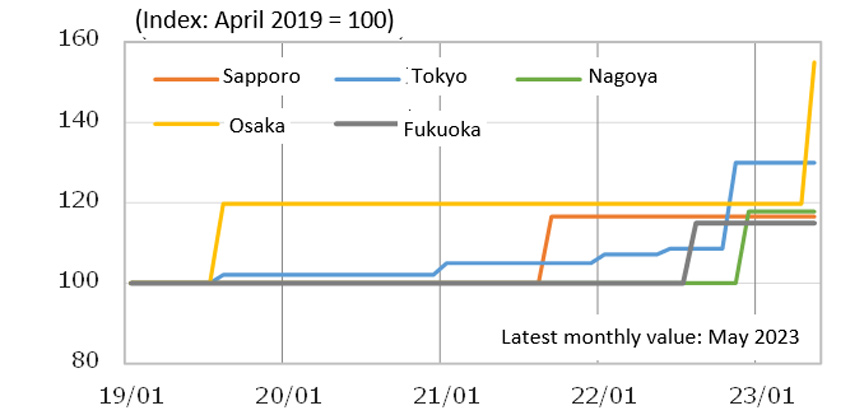 Fig.8: Trends in ready-mixed concrete prices
Compiled from “Quantity Survey Data", Economic Research Association
*1: Four companies: Obayashi Corporation, Kajima Corporation, Shimizu Corporation, and Taisei Corporation.
*2: Five companies: Asahi Kogyosha Co., Ltd. , Sanki Engineering Co., Ltd. , Taikisha Ltd., Dai-Dan Co., Ltd., and Takasago Thermal Engineering Co., Ltd.
*3: Five companies: Kandenko Co., Ltd., Kyudenko Corporation, Kinden Corporation, Toenec Corporation, Yurtec Corporation.
*4: Formula for calculating common temporary construction expenses, site management costs, and general management costs when calculating estimated prices for public works projects.
*5: Nikken Sekkei Standard Building Price Index (NSBPI): An index showing price movements in construction prices, calculated independently by Nikken Sekkei Ltd. The index is calculated using standard tenant office space as a quantitative model and reflects actual construction prices determined by Nikken Sekkei's own surveys as needed. The first quarter (Q1) is from January to March, Q2 is from April to June, Q3 is from July to September, and Q4 is from October to December.
*6: Three companies: Nippon Sheet Glass Co., Ltd., AGC Inc., Central Glass Co., Ltd.