Cost Management Report
「Competitive conditions persist Rising materials prices to push up construction costs」
Scroll Down
This report has been prepared by the Cost Management Group of the Engineering Division of Nikken Sekkei Ltd for information purposes. The information in this report is current at the time of publication and its completeness cannot be guaranteed. The contents are subject to change without notice. Unauthorized reproduction of this report is prohibited.
Competitive conditions persist Rising materials prices to push up construction costs
Orders received, work on hand steady
*Obayashi Corporation, Kajima Corporation, Shimizu Corporation and Taisei Corporation. Takenaka Corporation is not included because it does not disclose its quarterly results.
Difficult competitive environment continues
-
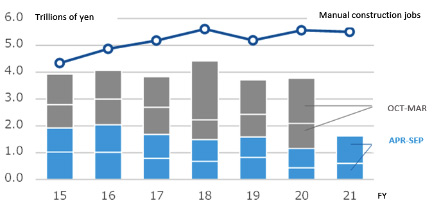 Fig. 1: Trends in orders received and work-on-hand at 4 major construction firms
Source: Compiled from the financial data of each firm. The count for construction projects on hand in FY21 is as of September. -
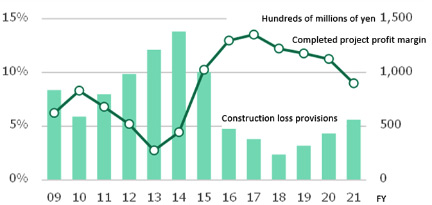 Fig. 2: Trends in profit margins & provisions for losses on construction contracts at 4 major construction firms
Source: Compiled from the financial data of each firm. The count for construction projects on hand in FY21 is as of Sept. Figures for profit margin on completed construction & allowance for loss on construction = 4-company avg.
The increase in large construction projects is a competitive factor
Materials prices are increasing
Construction costs are rising
-
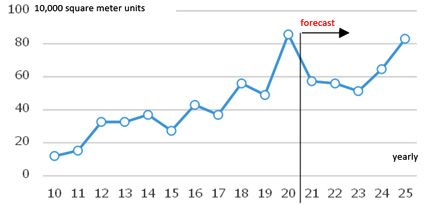 Fig. 3: Supply of office space of 100,000 sq.m. or more per unit in Tokyo's 23 wards / 3-year historical moving average
Source: Mori Building survey of large-scale office building market trends in Tokyo's 23 wards. -
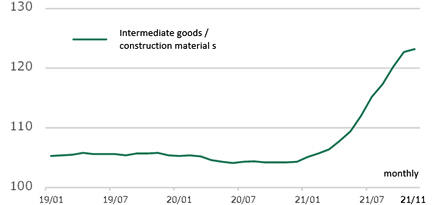 Fig. 4: Price index of construction materials
Source: Bank of Japan: Corporate Goods Price Index by Demand Level and Use.
NSBPI Rises Slightly in All Three Districts
Nikken Sekkei Standard Building Cost Index (NSBPI)
-
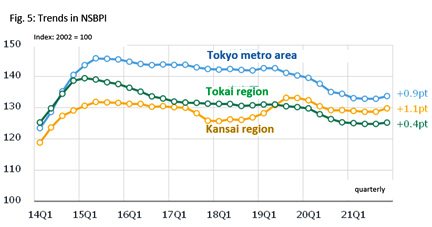 Fig. 5: Trends in NSBPI
-
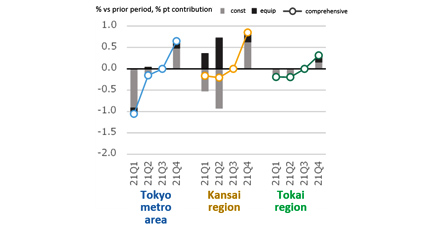 Fig. 6: % change in NSBPI & contribution of construction and equipment
Steel prices continue to rise
Lumber price rise pauses
Labor shortage persists
-
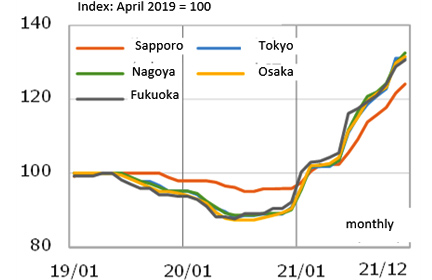 Fig. 7: Changes in steel prices (ordinary steel)
Source: Economic Research Council cost estimation data -
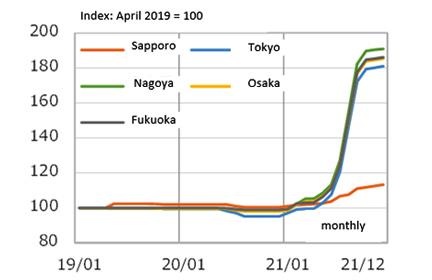 Fig. 8: Trends in timber prices
Source: Economic Research Council cost estimation data -
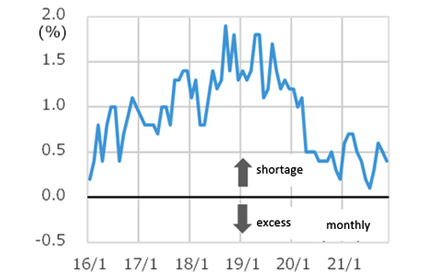 Fig. 9: Trends in the “over/under” ratio of skilled construction workers
Source: Ministry of Land, Infrastructure, Transport and Tourism, construction labor supply & demand survey (8 occupations, nationwide, seasonally adjusted)