Cost Management Report
January-March 2024 issue.
「Main Scenario for 2024 Construction Prices: Continued Rise Despite Slowing Momentum; Upside & Downside Risk Awareness is Warranted」
Scroll Down
This report has been prepared by the Cost Management Group of the Architectural Design Dept. of Nikken Sekkei Ltd for information purposes. While the information in this report is current as of the date of publication, its completeness is not guaranteed. The contents are subject to change without notice. Unauthorized reproduction of this report is prohibited.
Main Scenario for 2024 Construction Prices: Continued Rise Despite Slowing Momentum; Upside & Downside Risk Awareness is Warranted
Construction prices are expected to rise moderately in 2024
Materials prices will remain high
-
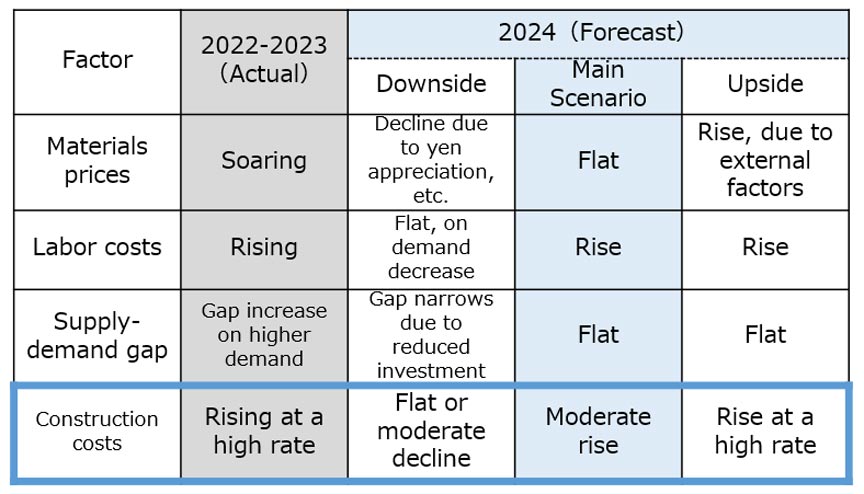 Fig.1: 2024 Construction Cost (NSBPI) Forecast
Source: Nikken Sekkei -
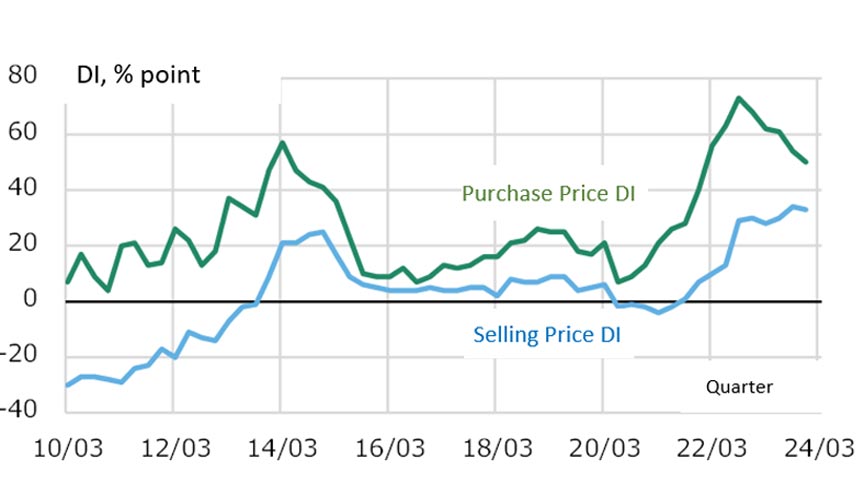 Fig.2: Construction Industry Selling Price & Purchase Price DIs (Large Companies)
Compiled from the Bank of Japan's Corporate Goods Price Index.
Labor supply constraints will continue due to labor shortages and the "2024 Problem“
No progress in eliminating the widening supply-demand gap
-
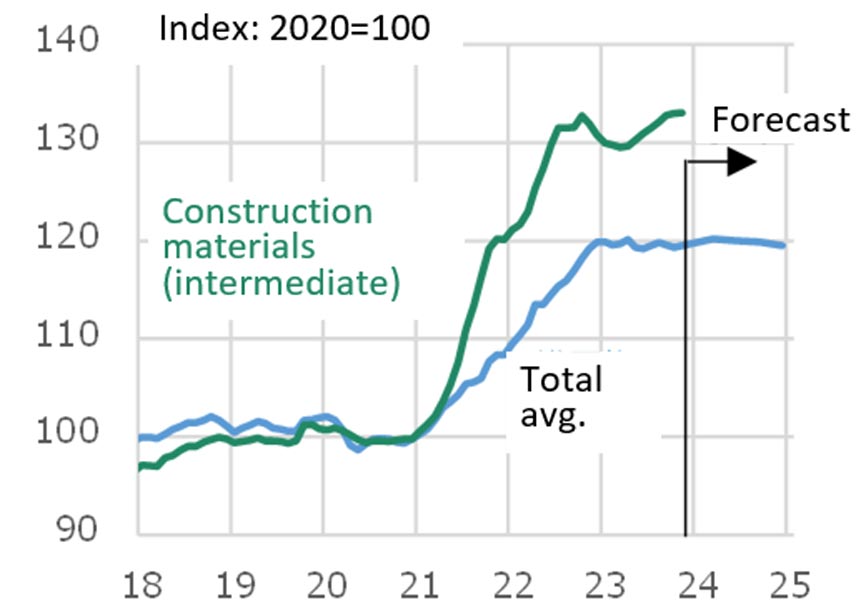 Fig. 3: Corporate Goods Price Index
Compiled from the Bank of Japan's Corporate Goods Price Index and the Japan Center for Economic Research's Short-term Economic Outlook.The index for construction materials (intermediate materials) is based on the 2015-based index by stage of demand and by use, and is compiled from the list of item classifications and weights. -
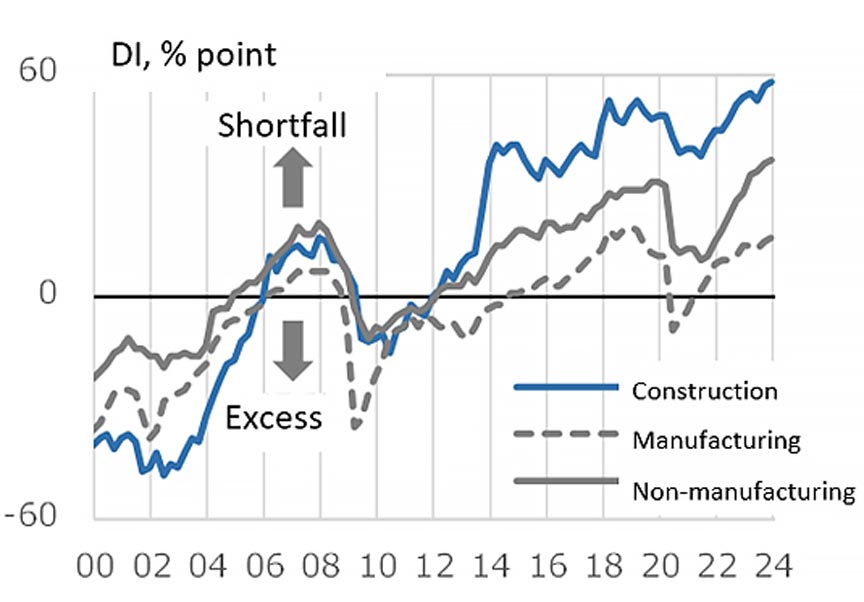 Fig. 4: Employment DI (Large Companies)
Compiled from the Bank of Japan's ”Tankan” quarterly poll of business confidence. -
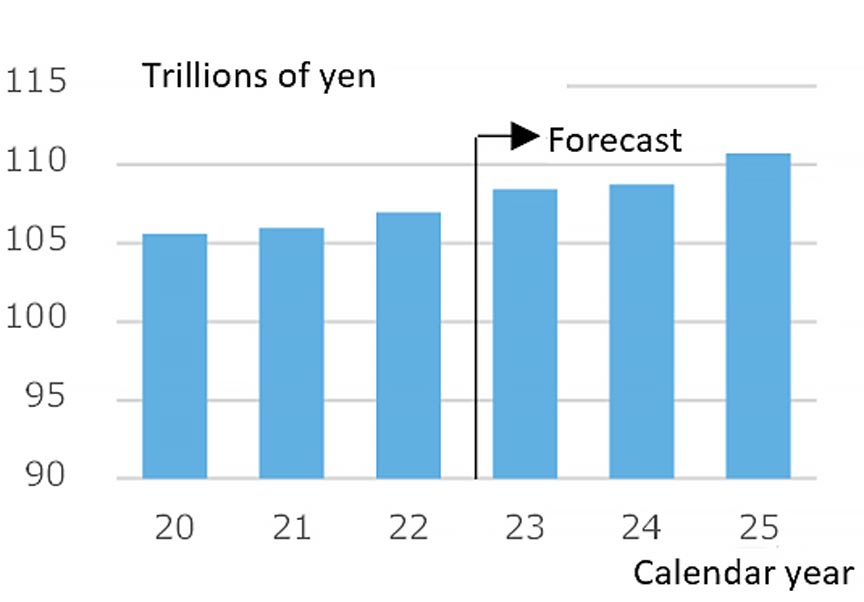 Fig. 5: Trends in Real Private-sector Housing Investment & Real Private-sector Equipment Investment
Source: Japanese Government Cabinet Office’s Preliminary Quarterly GDP Report, and the Center of Japan Economic Research’s Short-term Economic Outlook.
Composite Index Continues to Rise as Momentum Weakens
The Nikken Sekkei Standard Building Price Index NSBPI*1
Regarding MEP work, labor costs and specialized building costs moved higher. The overhead cost ratio also continues to rise due to the "2024 Problem" and other factors.
-
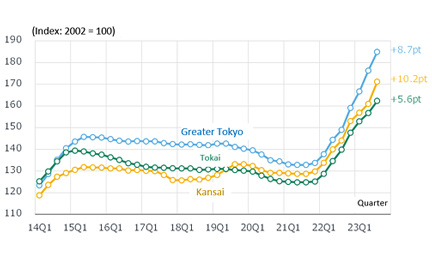 Fig. 6: Changes in NSBPI
-
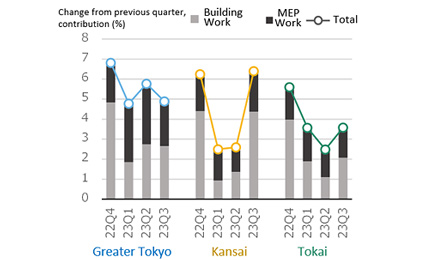 Fig. 7: Percent Change in NSBPI & Building Work, MEP Work Contributions
The NSBPI and the Construction Research Institute's Building Cost Index Show Divergence
Unlike the Building Cost Index, the NSBPI covers construction costs, including sales decisions such as the willingness of contractors to accept orders. It also incorporates upward revisions in general contractors’ estimates due to the bullish order-taking stances taken by specialized contractors and MEP subcontractors for automated controls and fire extinguishing equipment, etc. due to their busy work schedules.
-
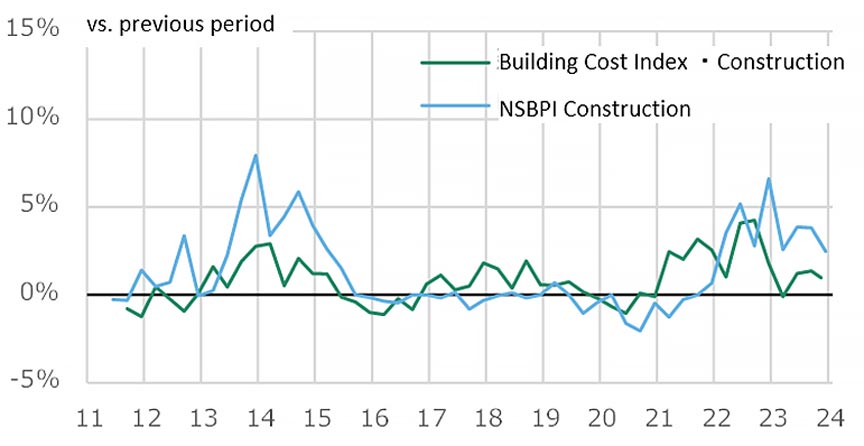 Fig. 8: Quarter-on-quarter Change in NSBPI vs. Building Cost Index
Compiled from Nikken Sekkei data and the Construction Research Institute's Building Cost Index.
The quarter-on-quarter change is the quarterly rate of increase or decrease for both the NSBPI and the Building Cost Index. -
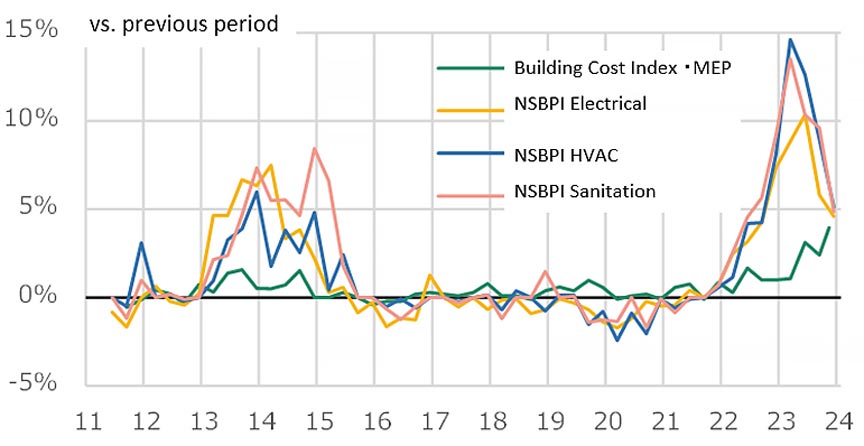 Fig.9: Quarter-on-quarter Change in NSBPI vs. Building Cost Index for MEP
Compiled from Nikken Sekkei data and the Construction Research Institute's Building Cost Index.
The quarter-on-quarter change is the quarterly rate of increase or decrease for both the NSBPI and the Building Cost Index.
*1: The Nikken Sekkei Standard Building Price Index NSBPI: an index that shows movements in construction prices, calculated independently by Nikken Sekkei. Using standard leased office space as a quantitative model, construction prices are calculated and indexed to reflect actual prices identified periodically via independent surveys. The first quarter (Q1) is January to March, Q2 is April to June, 3Q is July to September, and 4Q is October to December.
*2: The problem of overtime limits, as they apply to construction and logistics industries, from April 2024.