
Cost Management Report
「Construction Costs Soar Higher on Middle East Tensions」
SCROLL DOWN
The “Cost Management Report” (quarterly) provides an overview of domestic and international economic conditions and, drawing on a wealth of cost data derived from our track record as the leading architectural firm in market share, delivers timely, independent analyses of the construction market from a neutral perspective.
*This report has been prepared by the Cost Management Group of the Architectural Design Dept. of Nikken Sekkei Ltd for information purposes. While the information herein is current as of the date of publication, its completeness is not guaranteed. The contents are subject to change without notice. Unauthorized reproduction of this report is prohibited.



Construction Costs Soar Higher on Middle East Tensions
Major general contractors’ profit margins on completed projects exceed initial forecasts
Profit margins on completed projects continue to rise for equipment subcontractors
Figs. 1-3 Trends in Profit Margins on Completed Projects
-
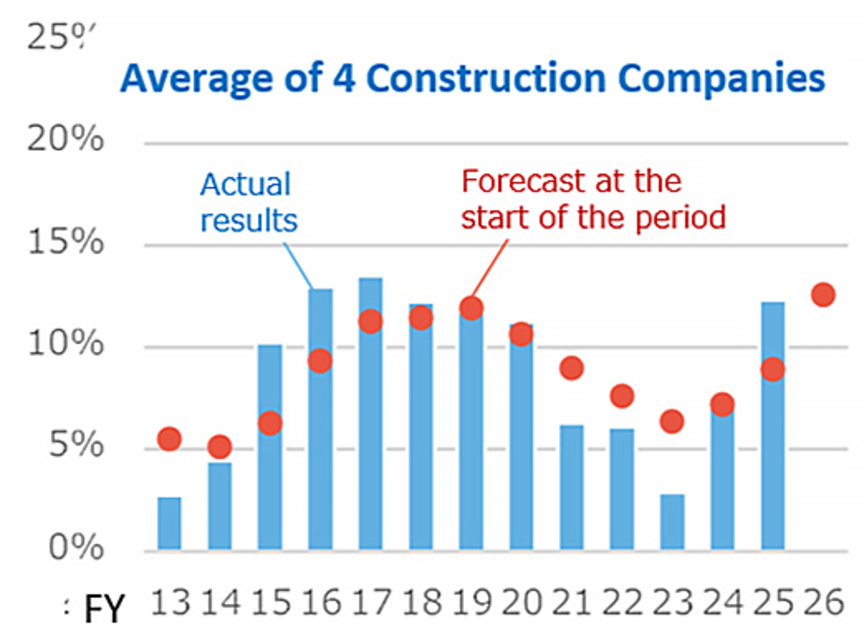 Fig. 1: Avg. of 4 Major General Contractors
Prepared from each company's financial data. -
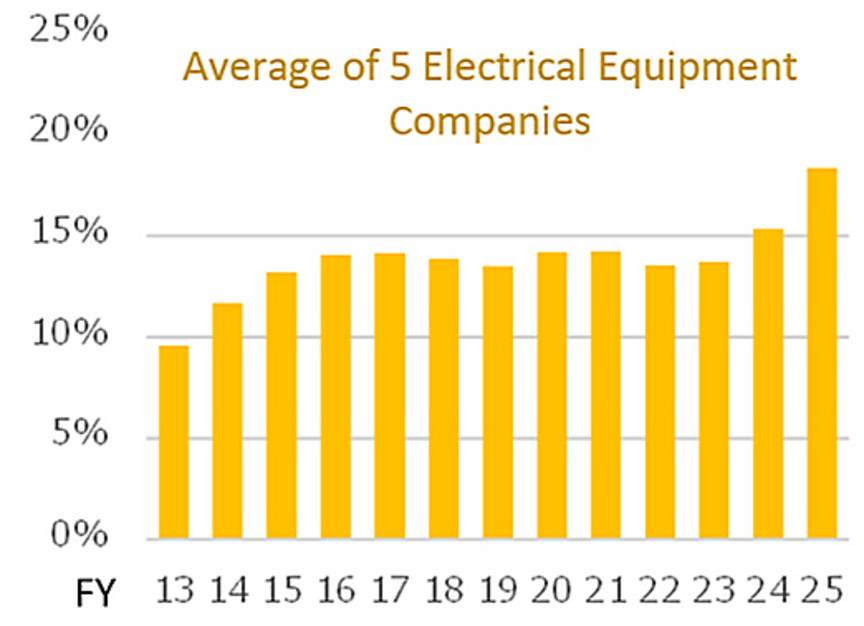 Fig. 2: Avg. of 5 Major Electrical Subcontractors
Prepared from each company's financial data. -
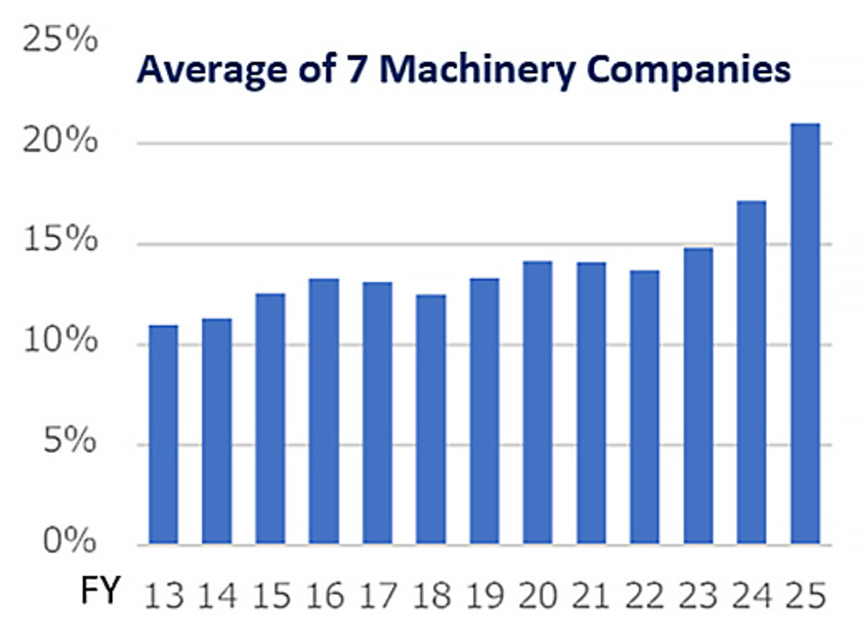 Fig. 3: Avg. of 7 Major Machinery Subcontractors
Prepared from each company's financial data.
Middle East tensions surface in construction prices
Despite some situational easing, estimated price impacts remain uncertain
-
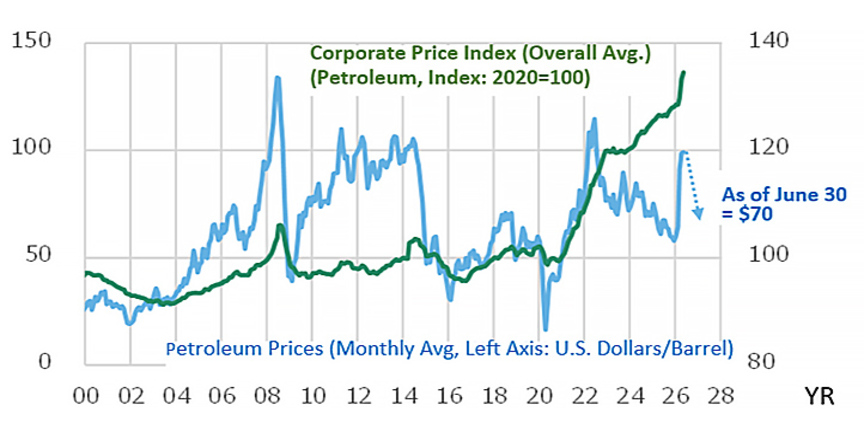 Fig. 4: Trends in Crude Oil Prices and the Corporate Price Index
The World Bank’s Commodity Prices and the Bank of Japan’s Corporate Goods Price Index. -
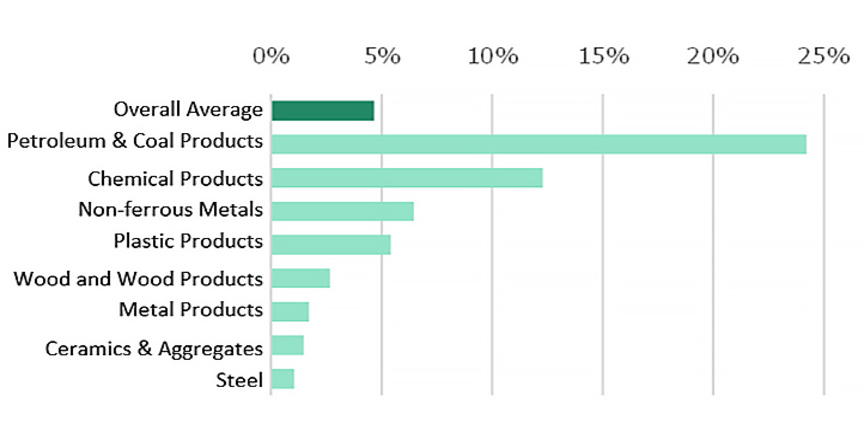 Fig. 5: Rate of Increase in the Corporate Price Index Before and After the Middle East Situation Deterioration
Compiled from the Bank of Japan’s Corporate Goods Price Index. Comparison of the latest figure (May 2026) with February 2026.
Construction Prices Return to the 2% Level vs. the Previous Quarter
Nikken Sekkei Standard Building Price Index NSBPI*5
For equipment installation work, the rate of increase expanded significantly compared to the previous quarter due to Middle East impacts, price revisions by equipment manufacturers, rising materials costs (such as electrical copper) in estimates, and increases in labor costs and overhead rates.
As a result, the quarter-on-quarter change in the composite index returned to the 2% level for the first time in three quarters (Figs. 6 and 7).
-
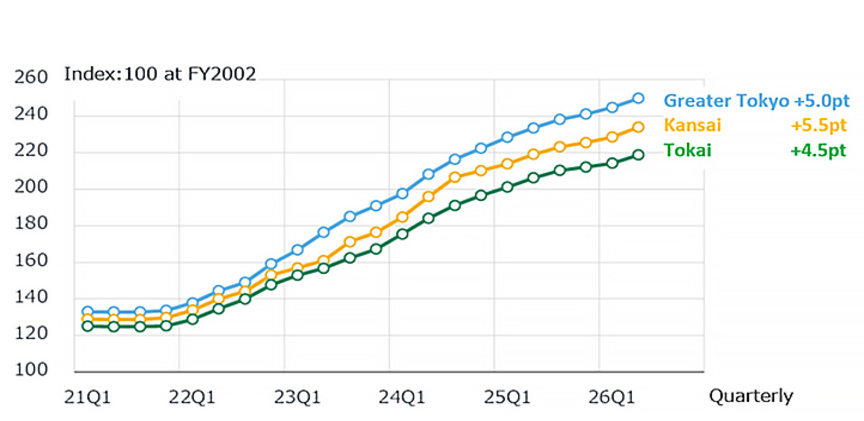 Fig. 6: Change in NSBPI
-
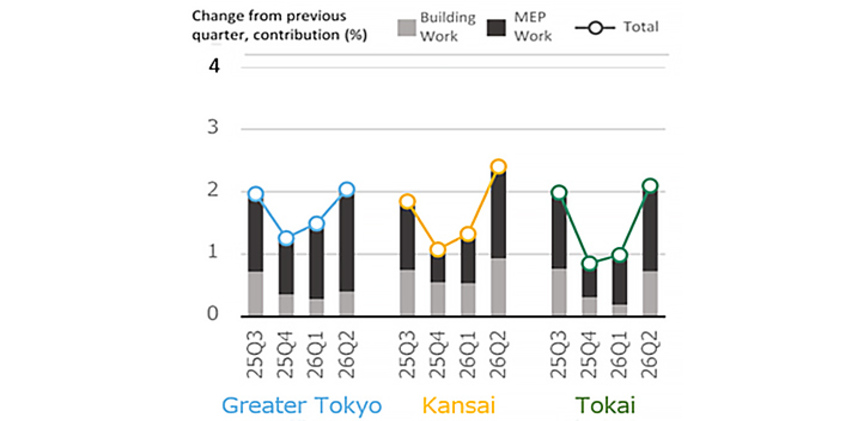 Fig. 7: Percent Change in NSBPI & Building Work, MEP Work Contributions
Ready-mix concrete prices rise in Osaka; Tokyo to raise prices next year
Perceived labor shortages remain high compared to other industries
-
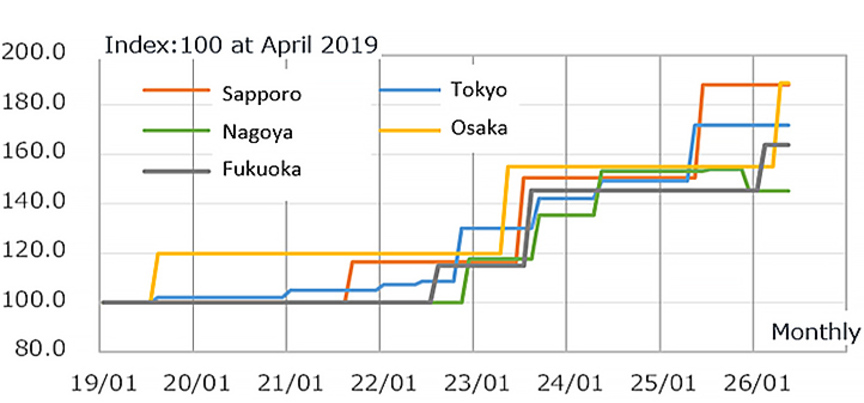 Fig. 8: Trends in Ready-Mix Concrete Prices
Compiled from the Economic Research Association’s Cost Estimation Data. -
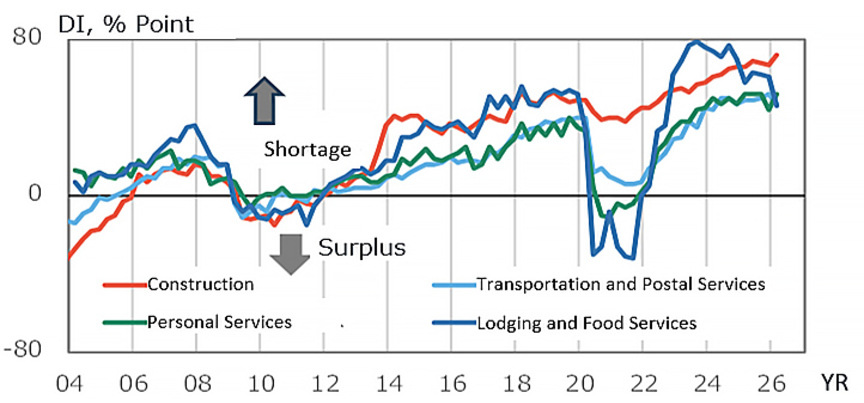 Fig. 9: Trends in the Employment Outlook DI (Large Firms)
Created from the Bank of Japan's Short-Term Economic Survey of Enterprises (Tankan).
*2: Based on each company's financial statements for the fiscal year ending March 2026.
*3: Five companies: Kandenko, Kinden, Kraftia, Toenec, and Yurtec.
*4: Seven companies: Asahi Kogyosha, Sanki Engineering, Shin Nippon Air Technologies, Shinryo, Taikisha, Dai-dan, and Takasago Thermal Engineering.
*5:Nikken Sekkei Standard Building Price Index (NSBPI):
An index showing price movements in construction prices, calculated independently by Nikken Sekkei Ltd. Using standard rental office space as a quantitative model,
the index is calculated and converted into an index of construction prices that reflect prevailing prices, as identified through independent surveys from time to time.
The first quarter (Q1) is from January to March, Q2 is from April to June, Q3 is from July to September, and Q4 is from October to December.
*This report is based on information as of noon on June 30, 2026.